JTB
Web and information graphics

Context
The brief
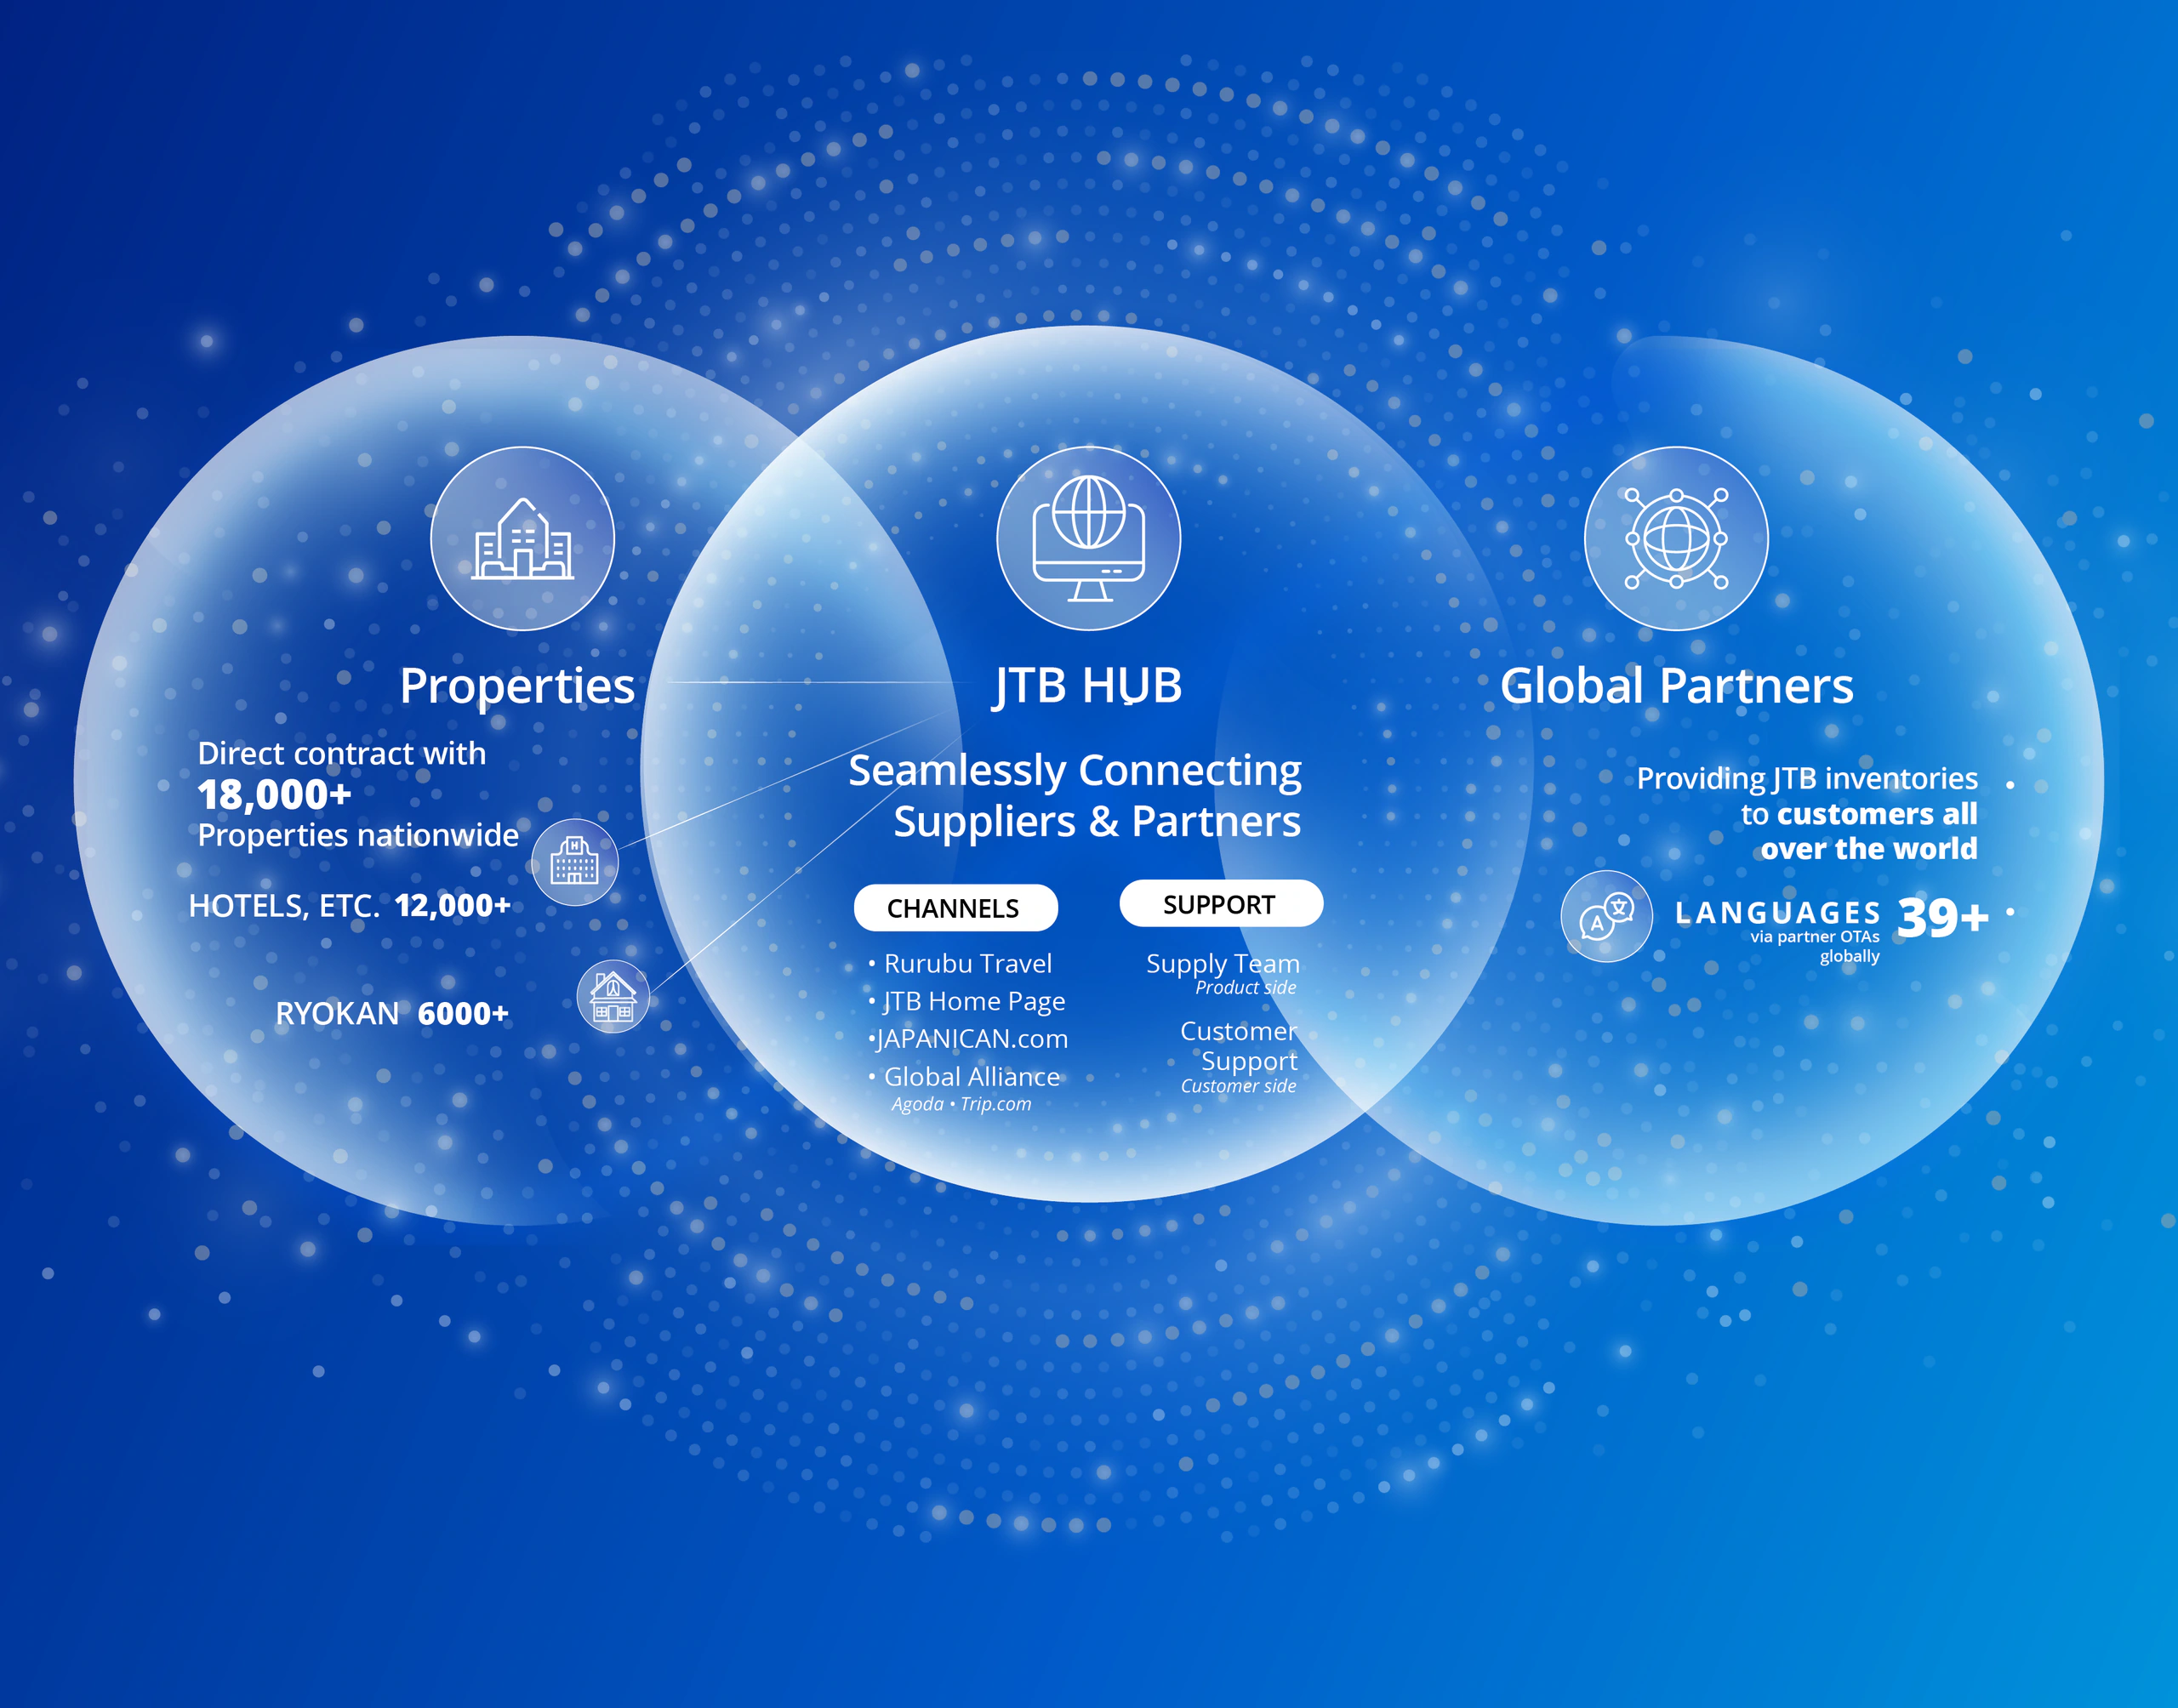
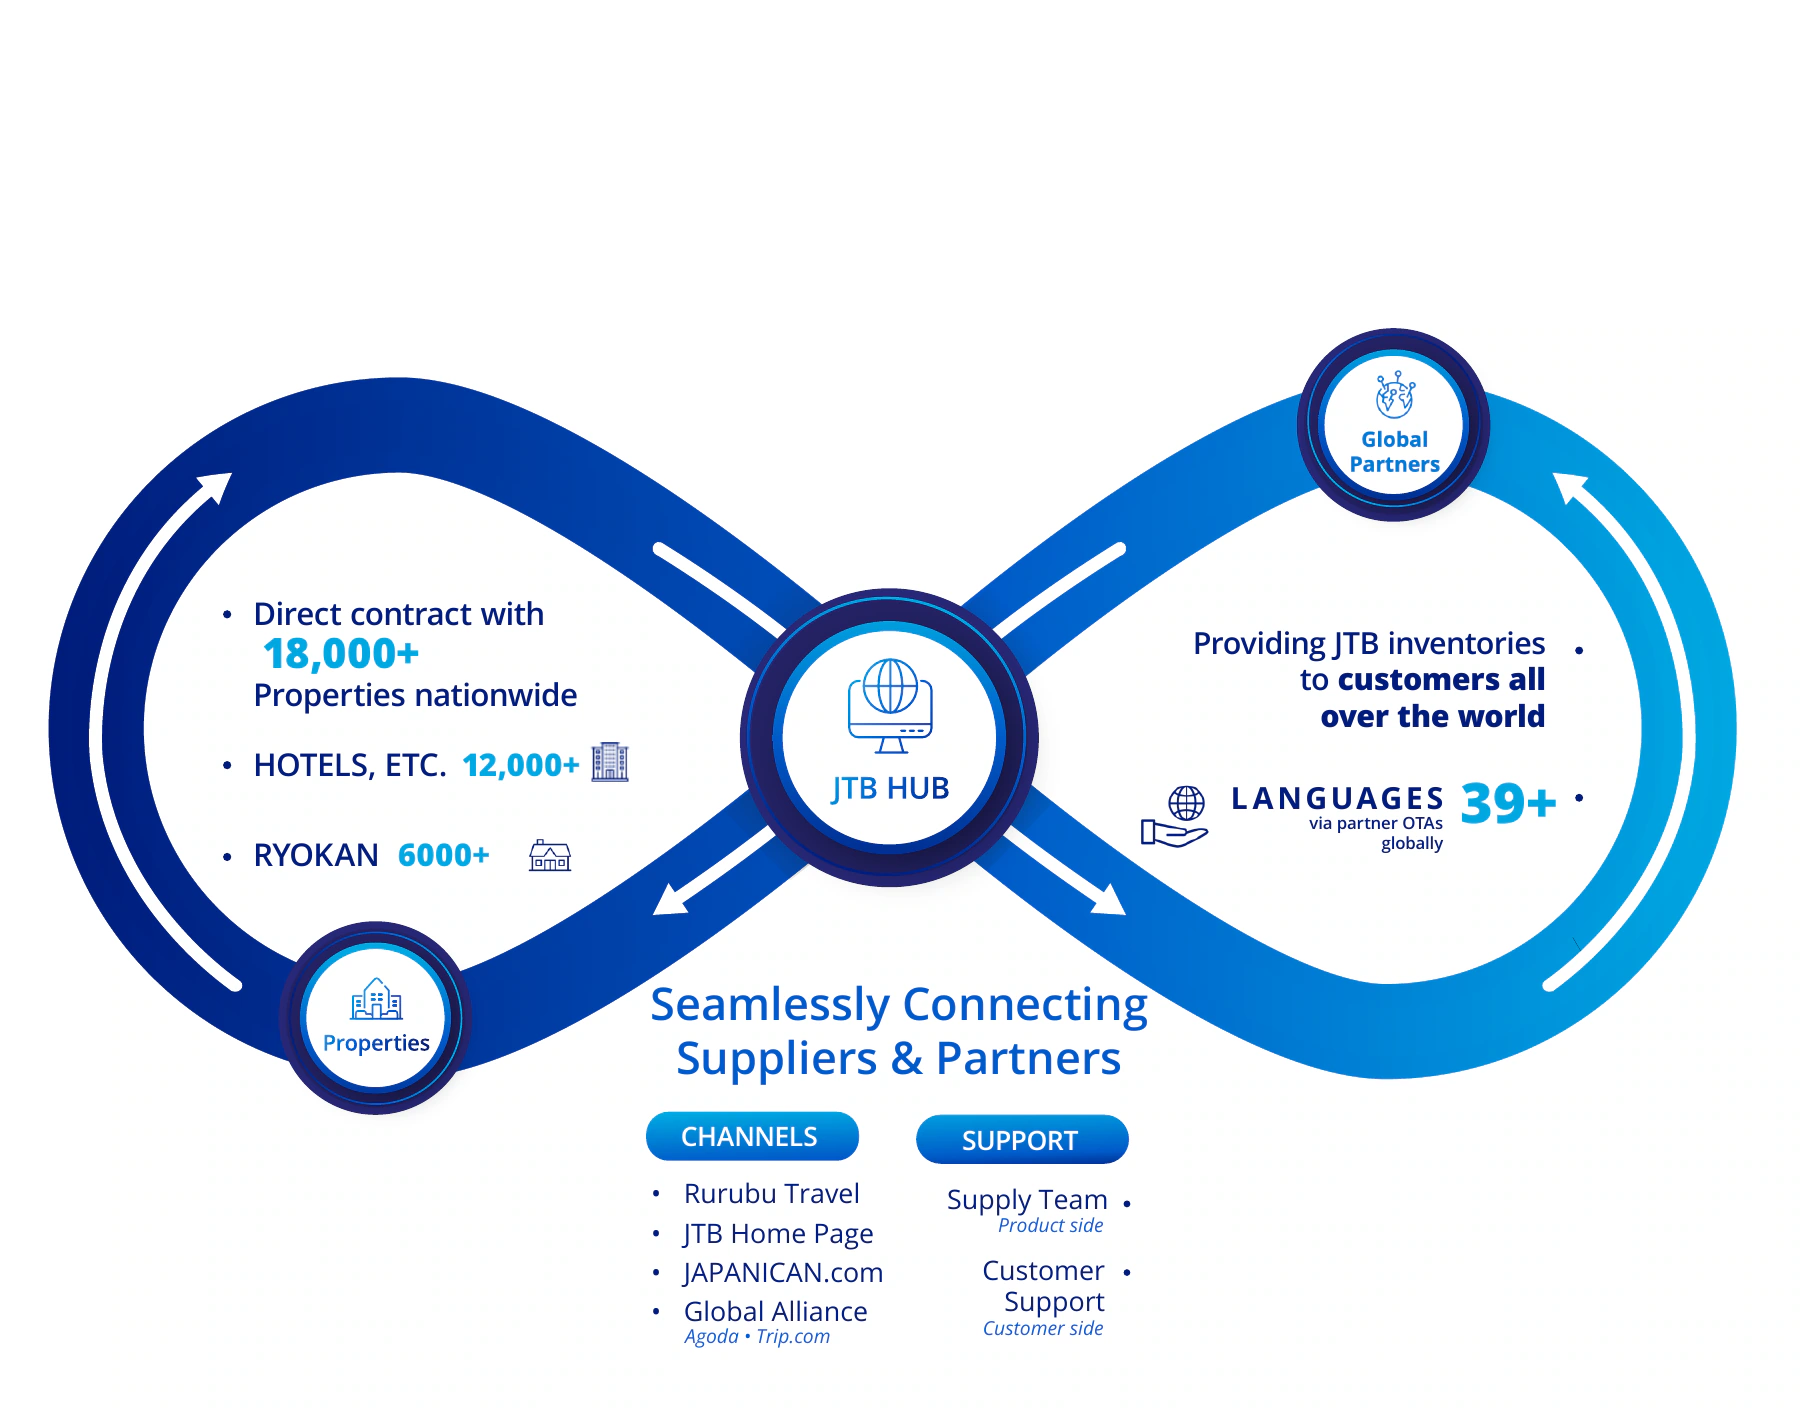
Web graphics showing how JTB connects properties, distribution channels and global partners.
Design outcome
Web graphics organise JTB’s supplier, distribution and partner information into a visual diagram.
Evidence basis: Qualitative outcome based on displayed workApproach
Information hierarchy
Connection diagrams
Deliverables
JTB HUB web graphic
Diagram variations
Selected work
JTB / Selected work
Related projects
Looking for similar experience?
Share the role or project, market, scope and timing. I’ll use that context to confirm fit and the next practical step.